Monitoring results
State of data :
Reports
- Bericht 23.3.2023
- Report 15.2.2023
- Report 31.10.2022
- Report 22.8.2022
- Report 24.7.2022
- Report 7.7.2022
- Report 20.6.2022
- Report 8.6.2022
- Report 2.6.2022
- Report 18.5.2022
- Report 28.4.2022
About the participants
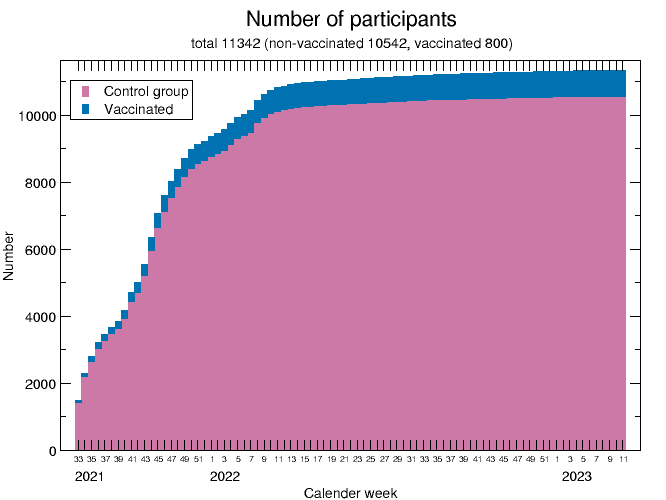
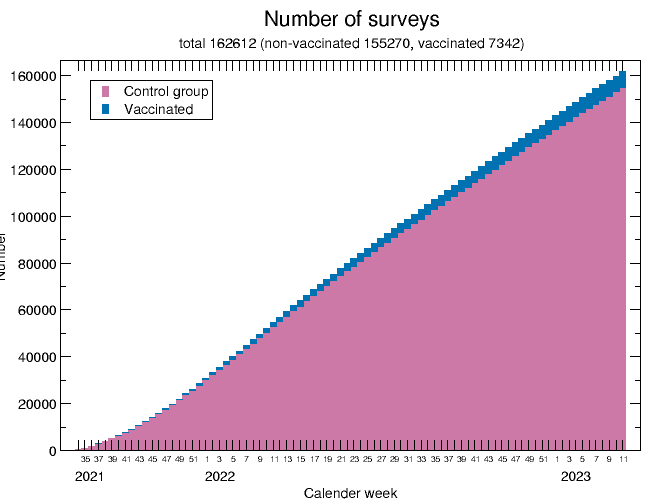
The total number of participants in a given calendar week is shown. Participants who have completed the intake form are counted. So far, the proportion of unvaccinated participants exceeds that of vaccinated participants.
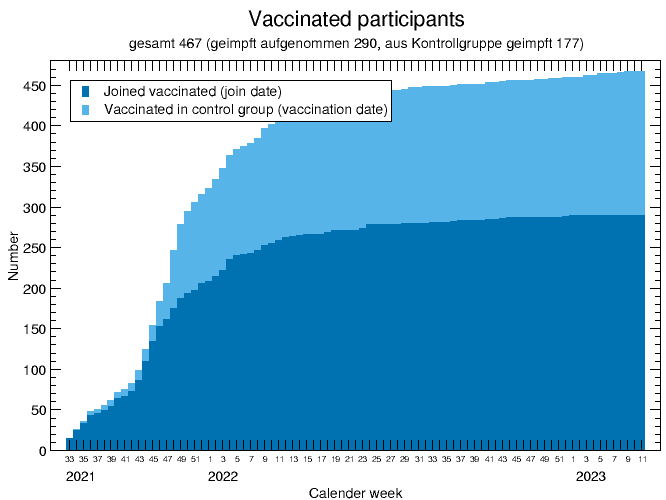
Cumulative number of vaccinated in monitoring who completed surveys, divided into participants vaccinated at intake and originally unvaccinated.
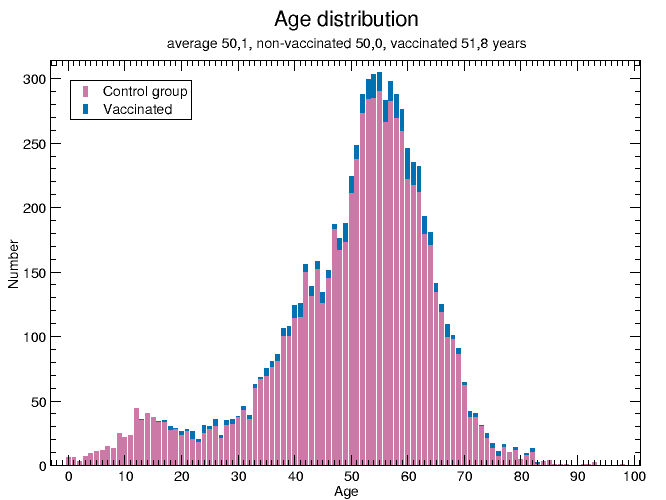
Most participants are between 50 and 60 years old. In comparison the age pyramid in Germany, younger people are underrepresented. The average age of the vaccinated is slightly above that of the control group.
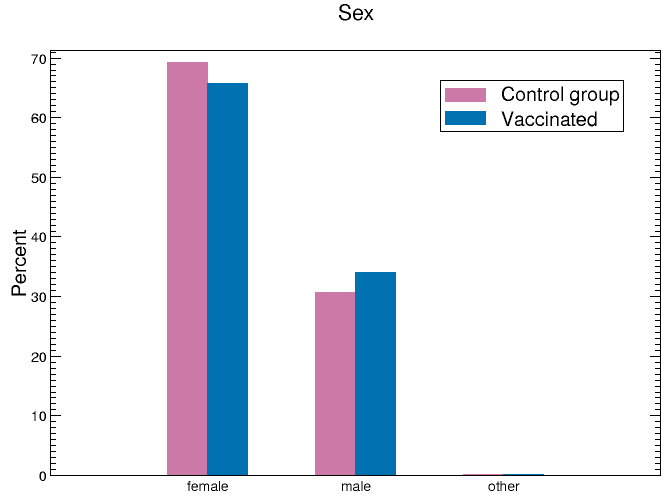
The majority of participants are female. The proportion in the control group is even slightly higher.
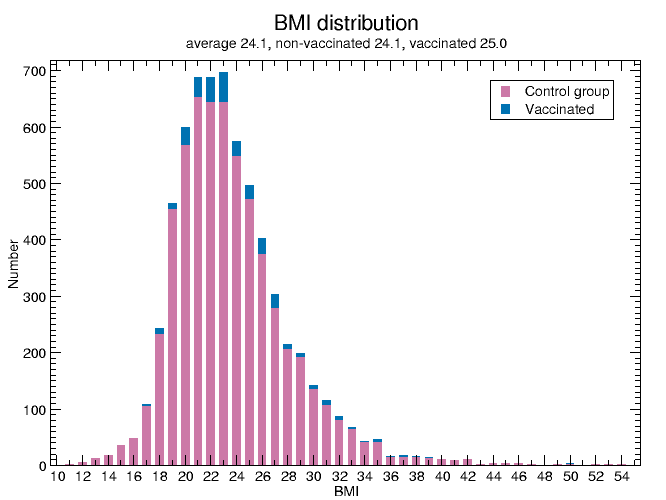
The body mass index (BMI) is typical for a cohort in Germany (average BMI 25.7). The BMI of the vaccinated is slightly higher than that of the control group.
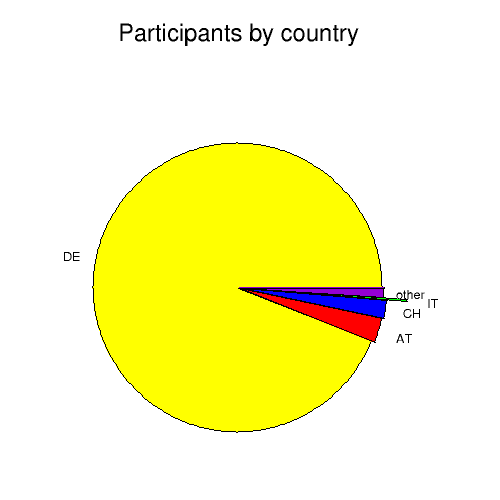
Most of the participants come from Germany, but increasingly also from Austria and Switzerland.
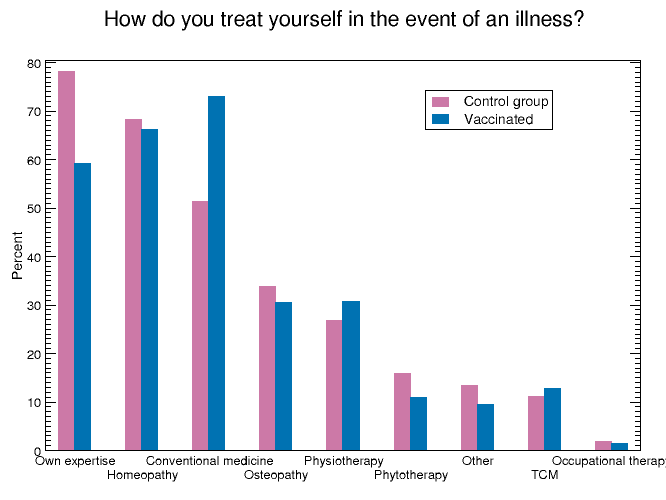
The high number of participants who rely on their own expertise is not surprising, as people who are willing to participate in a health willingness to participate in a health monitoring programme attach a high attach a high value to the topic of health.
The high number of those who rely on homeopathy is certainly due to the the fact that the control group was presented for the first time at a homeopathy conference.
Also not surprising is the higher rate of vaccinated patients among those who primarily treated with conventional medicine.
Befragungen
Shown here is the total number of completed fortnightly surveys.
Occurrence of symptoms
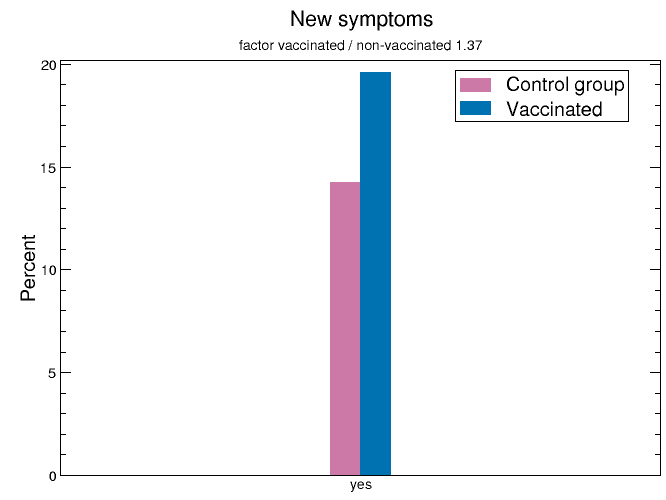
The occurrence of a new symptom is shown according to calendar week and vaccination status, i.e. if the question “Have you had a NEW symptom in the last 14 days?” was answered with “Yes”.
Respiratory diseases
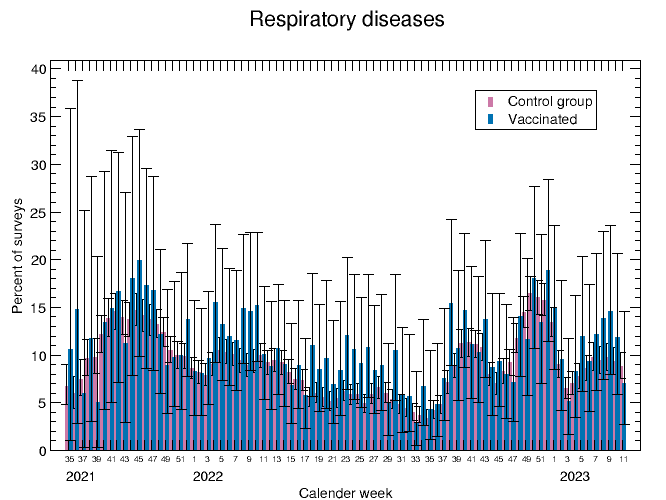
The occurrence of respiratory diseases is shown according to calendar week and vaccination status. Respiratory diseases are characterised by rhinitis, cough or sore throat. In people, people who entered the survey unvaccinated and were later vaccinated vaccinated, the interviews before vaccination are assigned to the unvaccinated status and the interviews afterwards are assigned to the vaccinated status. The 95\% confidence interval according to the exact Clopper-Pearson Clopper-Pearson method is shown.
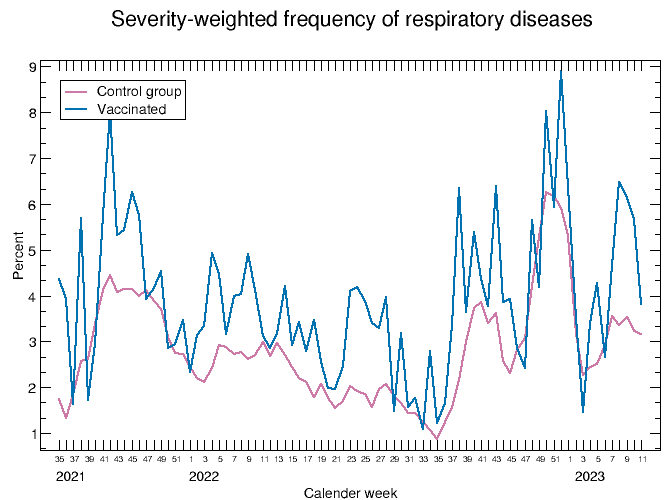
Shown is a representation of the occurrence of respiratory diseases weighted by severity. occurrence of respiratory diseases. The monitoring records symptoms in 5 severity levels from very mild to very severe, which are assigned numerical values from 1 to 5. For the severity of a respiratory the severity of a respiratory illness, the severity of the cold, cough and sore cough and sore throat are added together to give an overall score of 1 to 15. 15, whereby the percentage of the maximum possible 15 is shown here.
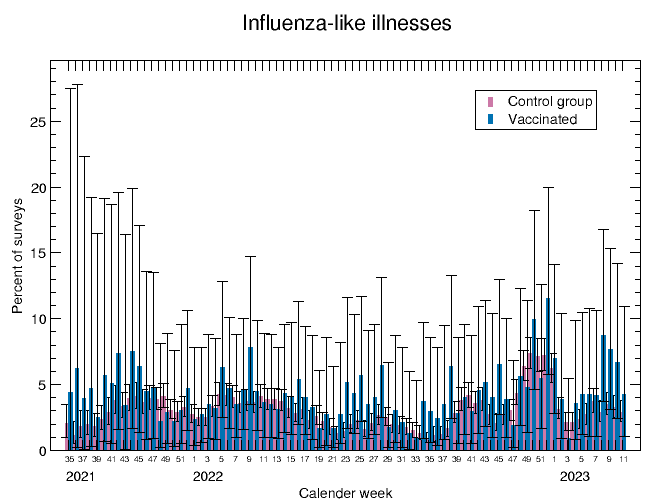
The occurrence of influenza infections is shown according to calendar week and vaccination status. Influenza infections are counted if one of the symptoms fever, chills or aching limbs has occurred in addition to a respiratory illness, chills or aching limbs.
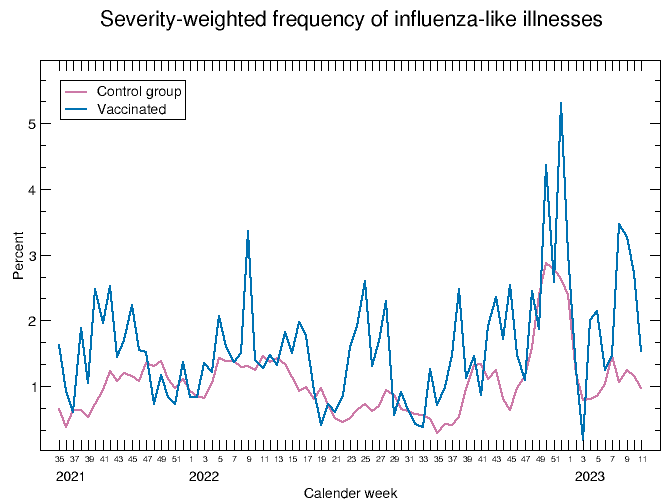
A representation of the occurrence of influenza infections weighted according to severity is shown. For the severity of an influenza the severity of a cold, cough, sore throat, fever, chills and aching limbs are added together to give an overall score of 1 to from 1 to 30, where again the percentage of the maximum possible possible 30 is shown.
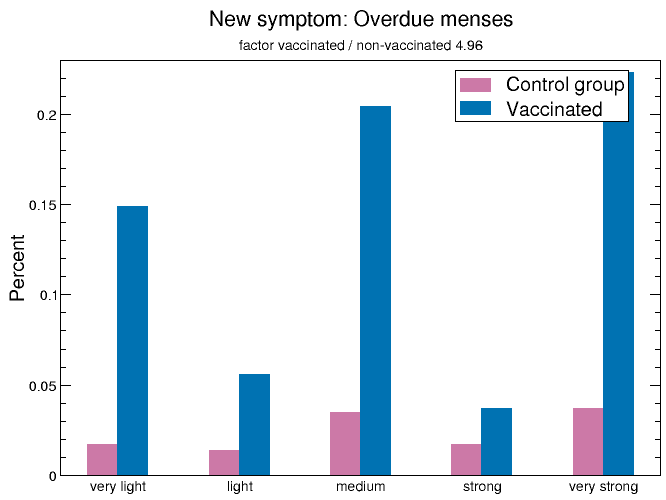
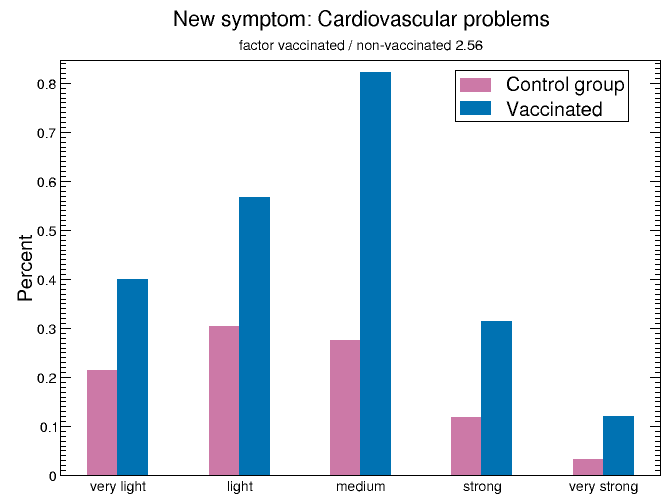
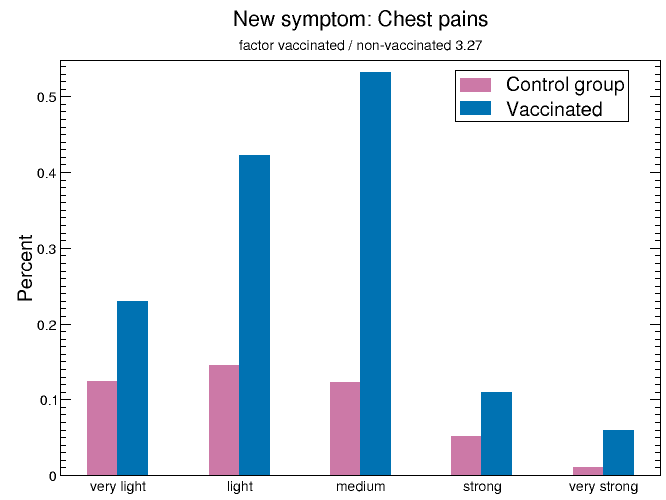
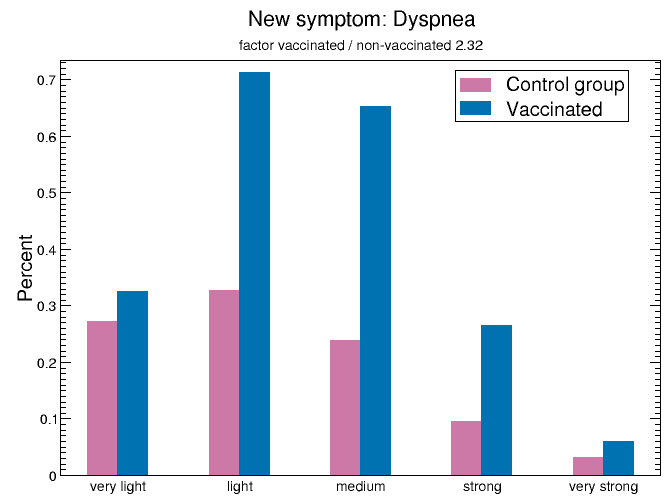
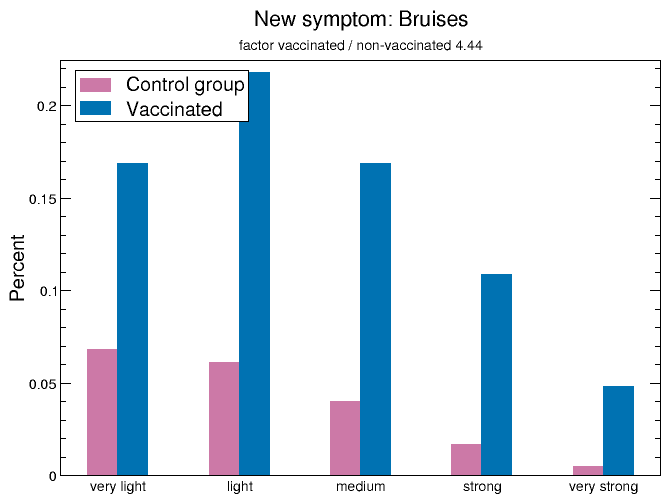
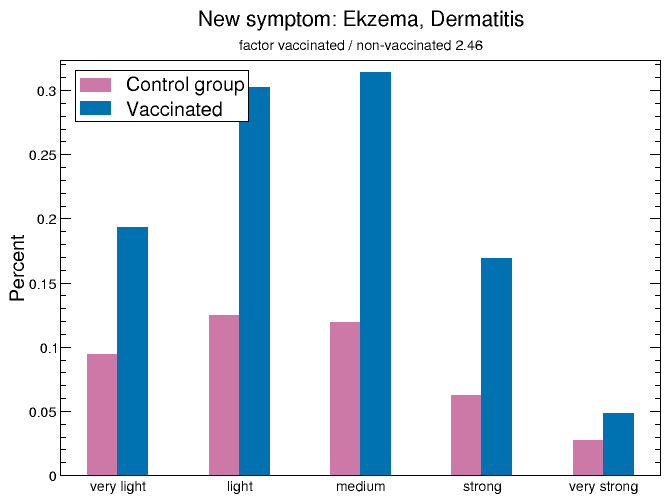
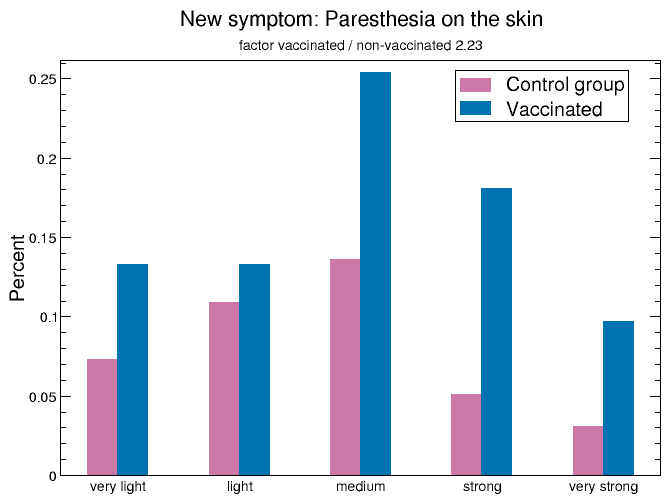
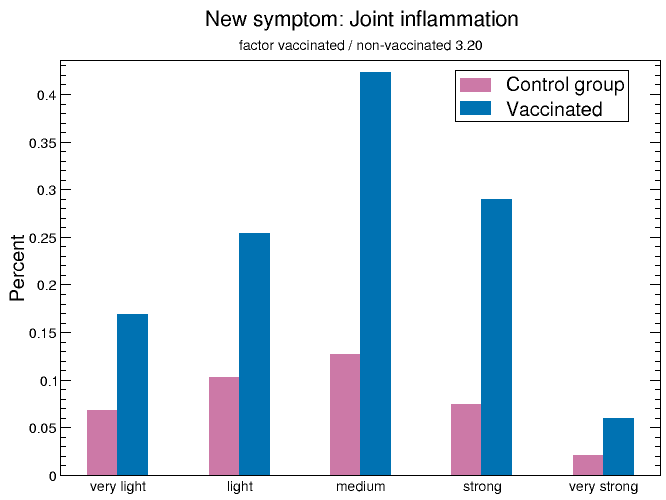
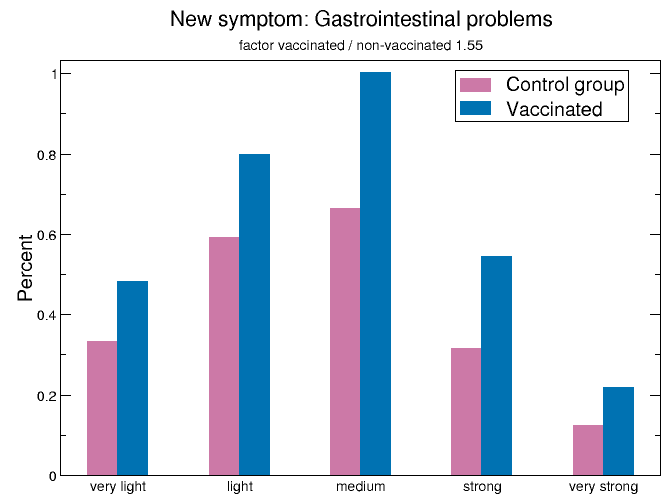
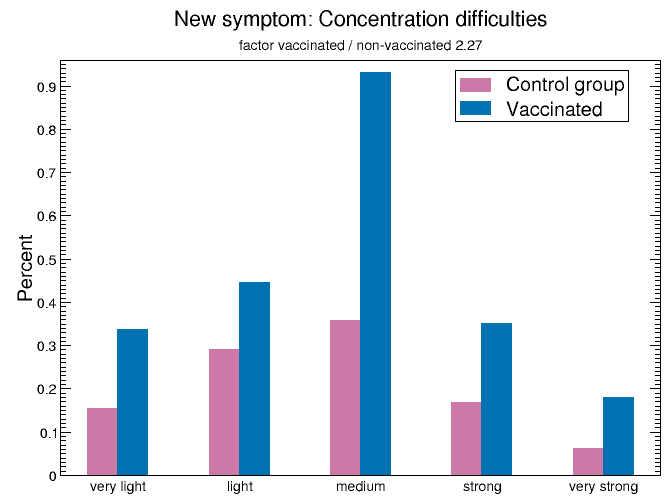
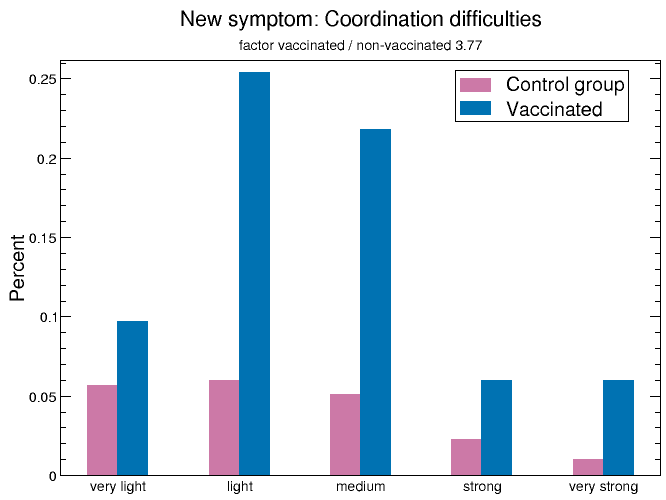
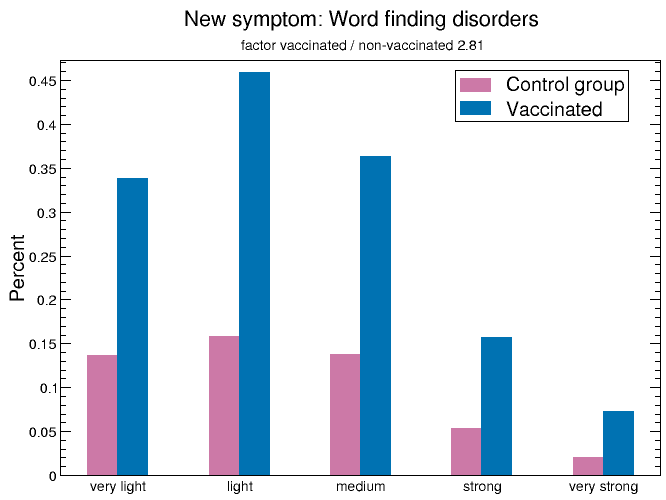
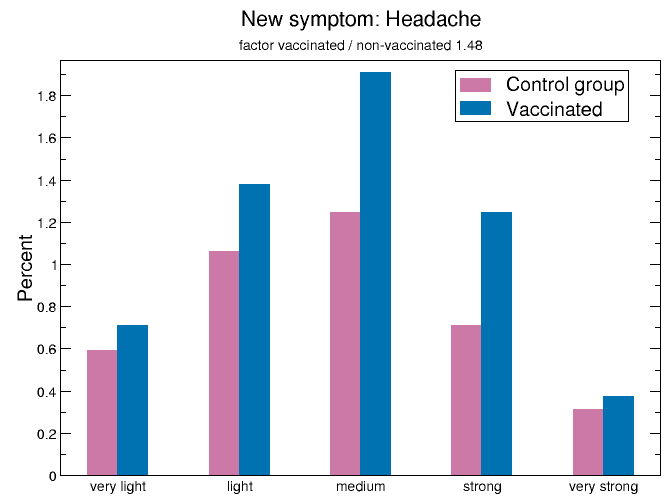
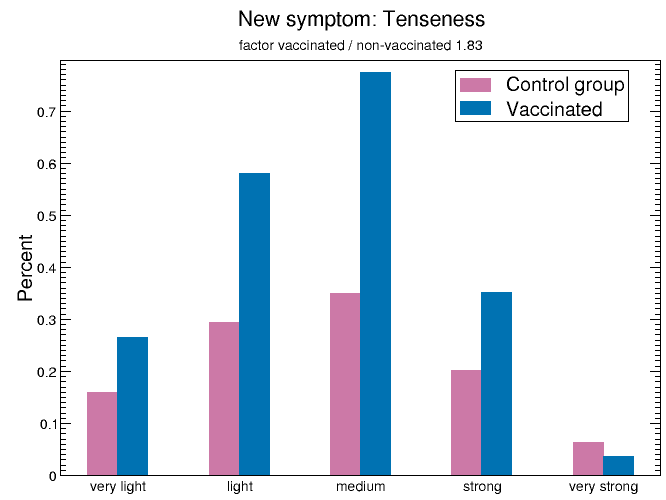
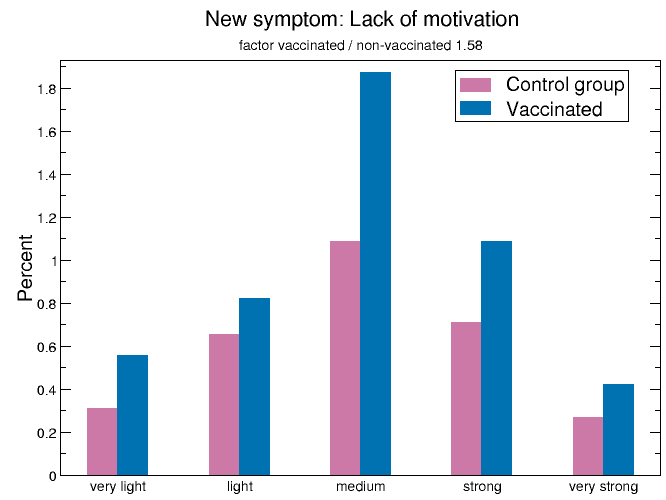
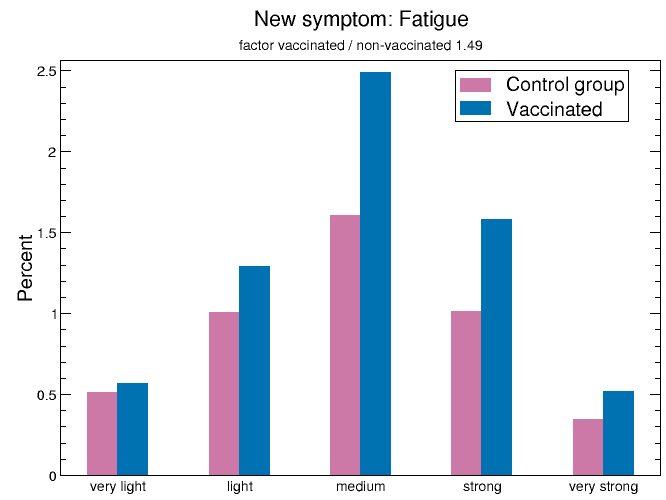
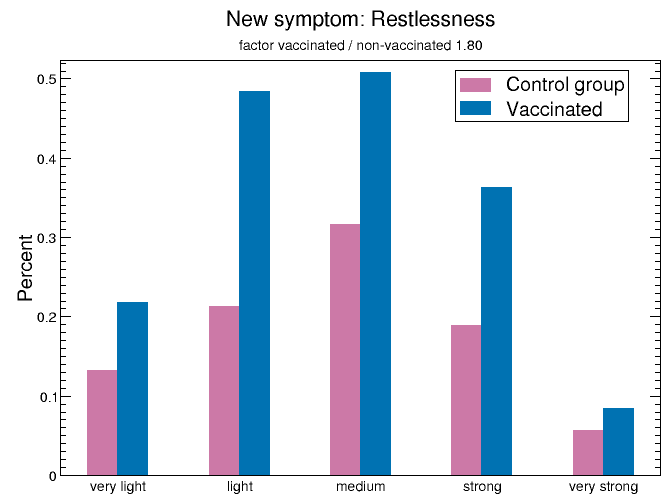
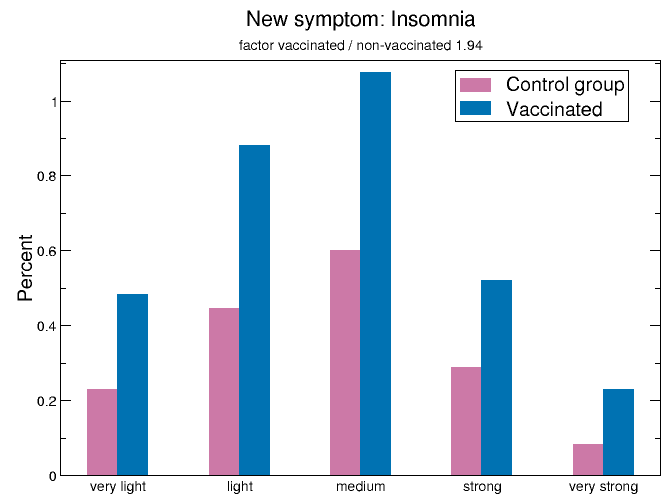
Occurence of specific symptoms
The occurrence of a single new symptom is shown. The response is split between the Covid vaccination status. For people who were vaccinated during the interviews, interviews before vaccination are assigned to the control group, interviews after vaccination to the vaccinated group.
New diagnoses
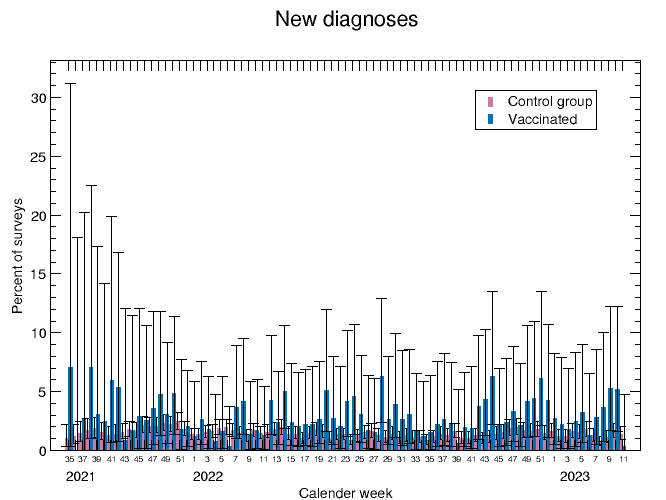
The occurrence of a new medical diagnosis is shown according to calendar week and vaccination status, i.e. if the question “Have you had a NEW diagnosis or disease in the last 14 days?” was answered with “Yes”.